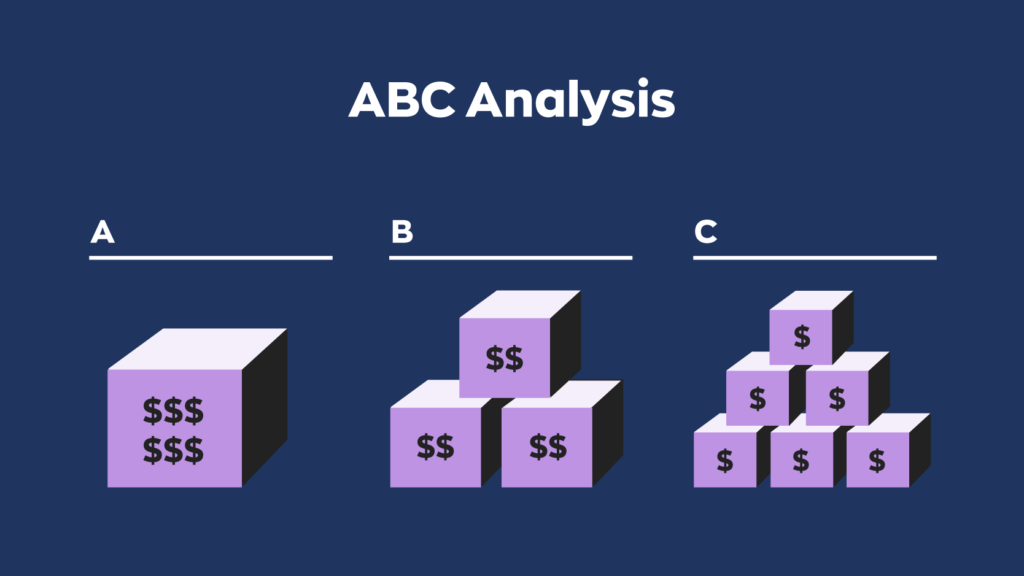
ABC analysis is a technique used to make more informed decisions on how much inventory to carry. Businesses using this classification of inventory management place their products into three categories: A, B, and C.
- Items in “Category A” are high-value products and typically make up 20% of total inventory. These products make up 80% of total revenue.
- Items in “Category B” are medium-value products, and typically make up 30% of total inventory. These products make up 15% of total revenue.
- Items in “Category C” are low-value products, and typically make up 50% of total inventory. These products make up 5% of total revenue.
Still, keep in mind that these numbers are estimates. It’s unlikely your own numbers will mirror these exactly, but there’s a good chance they’ll be in the same ballpark. This is also why cycle counting is frequently used alongside ABC analysis. It’s particularly beneficial to perform cycle counts among the more profitable Category A items. This helps to ensure a more current count of important inventory. This is an important principle, whether your business is focused on manufacturing, retail, or other inventory-dependent fields.
We also cover ABC analysis in our new podcast. Watch the short clip below!
What is ABC inventory analysis based on?
When talking about a concept like this, it helps to understand its foundation. In this case, ABC analysis is based upon the principle that 80% of the output is a result of 20% of the input. This is called the Pareto Principle, also known as the 80/20 rule.
It seems simple, right? Keep in mind, though, that the Pareto Principle is not absolute. Therefore, it doesn’t apply to every business, and the 80/20 ratio itself is not an exact figure, just an estimate.
There are a few ways to apply the Pareto Principle to a business. For now, though, we’re going to focus on how it applies to inventory management. In this case, the Pareto Principle states that 80% of a company’s revenue comes from 20% of its inventory.

Again, though: these numbers are just estimates. Obviously, different businesses have different systems, and these values tend to fluctuate between industries. At the same time, there’s enough truth to the Pareto Principle that it’s commonly accepted.
What benefits does the ABC inventory method offer?
The nature of ABC inventory classification means that you’ll be collecting information frequently. This information, in turn, leads to a lot of benefits. There are too many to count, so here are some of the important ones:
- Better pricing: Increased information allows businesses to set better prices for their products, and better prices lead to more sales.
- Improved resource allocation: ABC analysis optimizes the use of warehouse space. This results in less capital being tied up in a warehouse, which opens up available resources that can be used elsewhere.
- Better inventory prediction: The increased information flow helps businesses figure out what products are in demand. This helps maximize the amount of sales without overstocking products.
- Better customer service: A more detailed understanding of inventory and which items are most profitable can help to decide how best to offer service.
- Reduced storage costs: Having a more granular view of inventory helps avoid overstock, which in turn reduces the amount of storage required.

If performed effectively, ABC analysis is a valuable tool that helps organizations better understand the market and more adequately meet their customers’ needs.
How do you perform ABC analysis?
First — as with anything else — make sure that your numbers are accurate. If you’re doing this by hand, you’ll probably want a calculator as well. Start with a list of products that also includes annual demand, as well as per-unit cost. This ensures that the sample size is large enough and helps decide what products to buy for the next year.
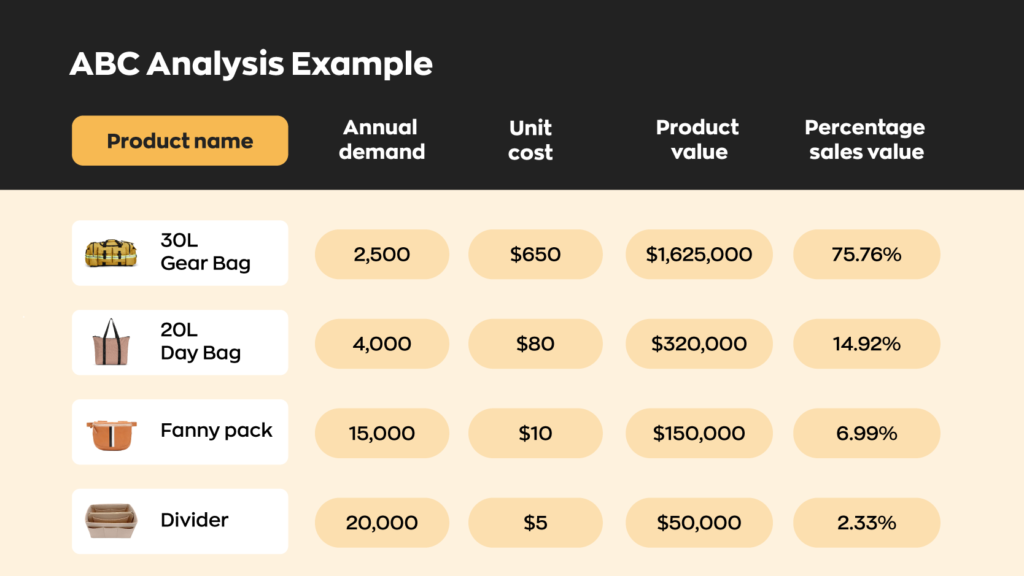
For this example, let’s say you own a business that sells backpacks. Your ABC analysis may look something like this:

To calculate product value, simply take your annual demand and multiply it by your unit cost. Once you have all your product values, add those up to get your total revenue. In this example, the total revenue would be $2,145,000. Next, calculate what percentage of revenue each product accounts for. For example, the 30-liter gear bags have a product value of $1,625,000 divided by the total revenue, which is $2,145,000. This means the percentage sales value for the 30-liter gear bags is 75.76%.
According to the “rules” of the ABC inventory method, 30-liter gear bags fall into category A. While 20-liter day bags make up category B, and fanny packs and dividers make up category C. Of course, these values don’t quite line up with the 80/20 rule of ABC analysis — and that’s ok! The important thing is that they’re in the ballpark. Congratulations! You’ve done your own ABC analysis.
Maintaining the system
Once you calculate (and implement) your own ABC classification of inventory, it’s important to maintain it. There are two key factors in keeping your system accurate:
- Keep things simple: Successfully implementing an ABC analysis system relies on having accurate information. At the same time, having too much information can overcomplicate things, so it’s best to limit it to what’s necessary. In fact, only collect information that’s absolutely necessary.
- Remain flexible: The market changes every day. Because of this, something that’s in demand one day might not be in demand the next. In this way, ABC analysis doesn’t remain accurate forever. It won’t become irrelevant the next day, but it’s necessary to reclassify items continuously.
- Use technology: Making use of automated inventory management systems can help make ABC inventory analysis more straightforward and efficient.
- Track shipments: It’s important to keep track of inventory even as it’s being transported to help quickly identify lost or damaged items.
Keeping things flexible (and simple) makes it easy to reclassify when necessary.

Limitations of ABC analysis
ABC analysis may be a useful tool, but it has its limitations. Some drawbacks include:
- Demands attention: Obviously, ABC inventory management is not something that you can set and forget. It requires constant attention, and if done incorrectly, it can cost money instead of saving it.
- Black and white classification: While the ABC classification of inventory is useful, it’s also fairly rigid. Just because category B and C class products are low value, that doesn’t mean that they have no value. For instance, if you don’t keep track of lower-value items, they might fall through the cracks, making things inaccurate.
- Subject to large change: Previously, we talked about how ABC analysis is sensitive to market changes. For this reason, products need frequent reclassification, which eats up both time and money.
- Potential for high resource demands: If items are misclassified, resources may be improperly allocated, resulting in time-consuming focus on unimportant items.
- Focus only on monetary value: The classification system is limited to financial value, which can ignore items that may have little financial value but could serve an important role. This may be particularly evident with components in manufacturing.
At the end of the day, every business has different needs for inventory management. ABC inventory isn’t for every business, so make sure it’s something you can benefit from before performing it.


0 Comments